
At the beginning of the U.S. spread of COVID-19, our team tracked the impact that market uncertainty and changing health concerns had on our multifamily clients. At the beginning of the pandemic, we saw a slump in website traffic and searches for apartment communities nationwide. As time progressed the trends changed and amidst the crisis, we saw an upward trend among our client base.
As we sit here in July, a key leasing period for multifamily communities, the leasing environment we are seeing looks healthier than what many of us might have imagined. Communities will continue to make tough decisions in the months ahead but from where we are sitting right now, the demand for rental housing and the desire for apartment seekers to move this summer is still strong. We looked at several signals across a variety of industry sources, combined with our own internal data to give you a glimpse into today’s rental market.
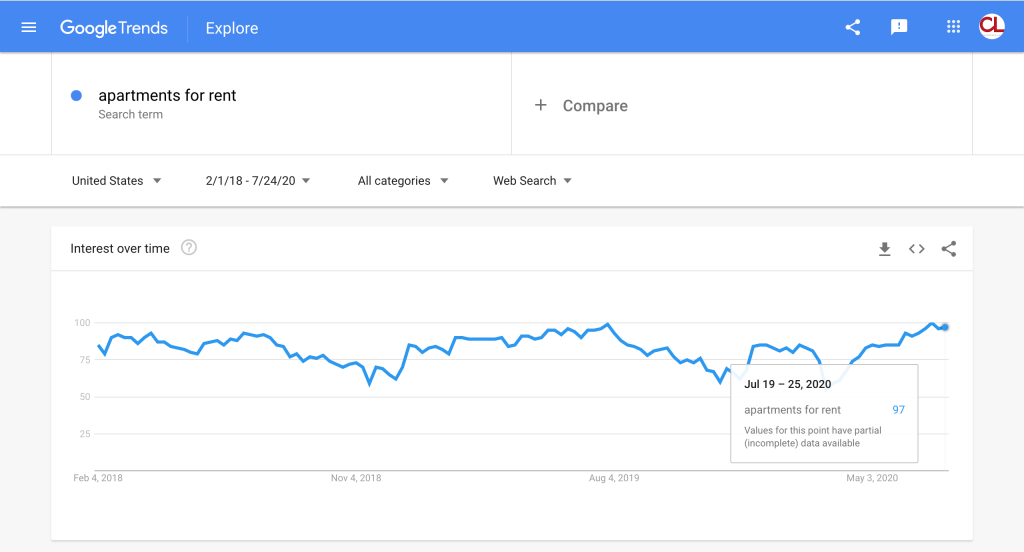
1. Google Trends
A commonly cited source for national search traffic, Google Trends shows the relative popularity that a search term has in a given period of time. Over the past year, searches for both “apartments for rent” and “apartments near me” show the resurgence of apartment searching beginning in the month of April and continuing into July. Search popularity for “apartments for rent” was even higher in early July this year compared to early July 2019. We saw this same search trend play out across our own client portfolio when looking at organic search website sessions over time.
2. Apartment Website Traffic
Communities typically experience a rise in website traffic in the spring and summer. While communities experienced a decline in March that dropped levels down into the typical winter season level of traffic they rose to meet the typical website traffic levels we are used to seeing in Spring and Summer. Since most apartment searching is happening online, a community’s website plays a large role in its ability to attract apartment seekers. Our own client base shows a 73% year over year rise in total website sessions and a 38% increase in website goal completions* (June 2019 vs. June 2020). This indicated that apartment seekers are spending more time on apartment sites and are more willing to engage with communities there.
*Goal changes are also impacted by the adoption of our website conversion software, better attribution, and overall marketing performance improvements that took place from June 2019 to June 2020.
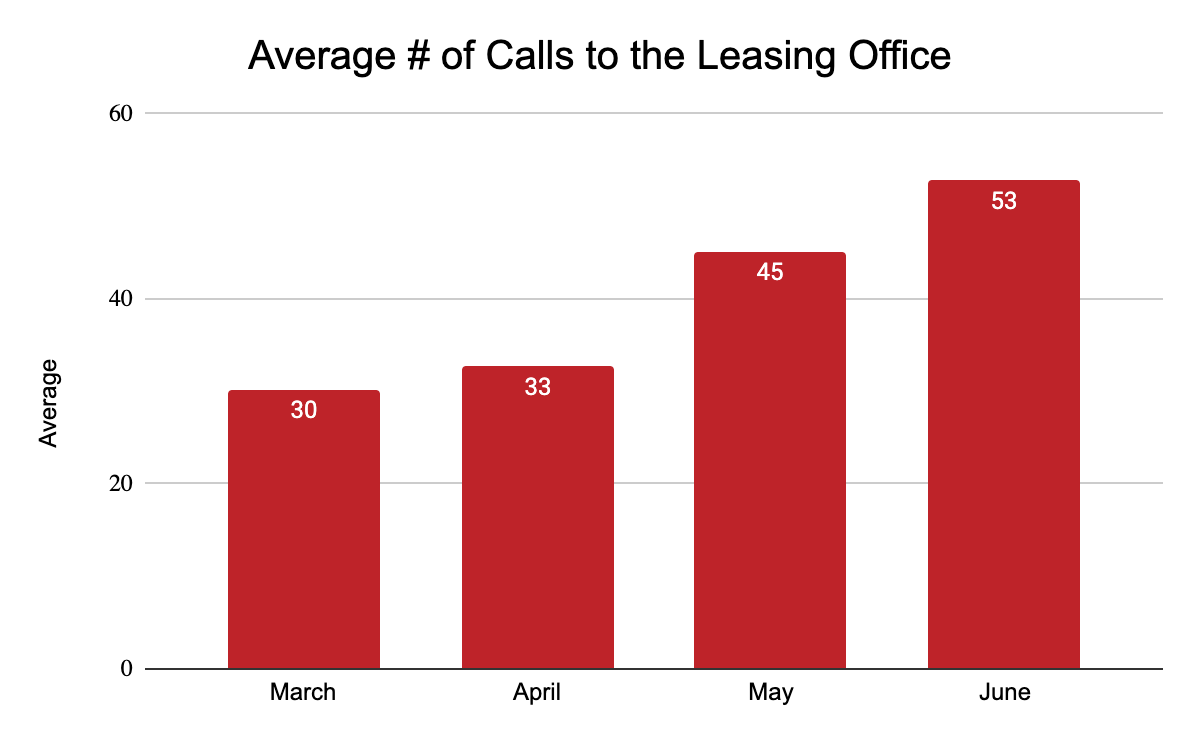
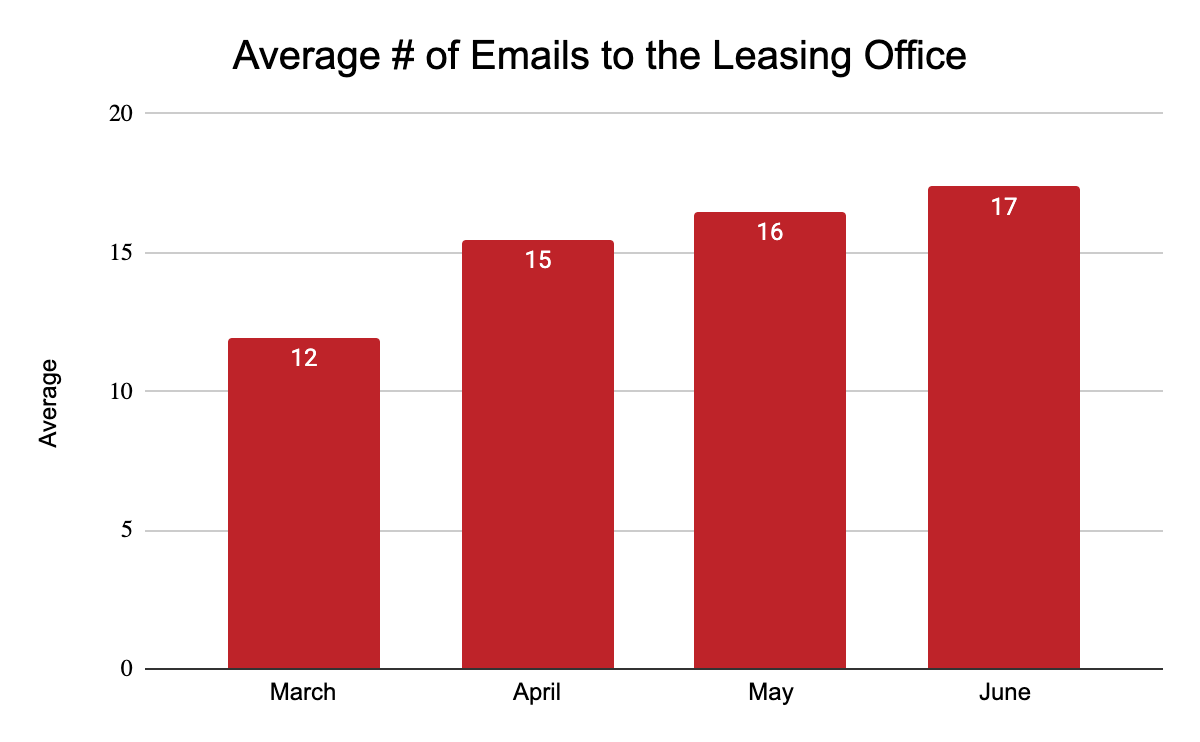
3. Communication (Chat, Phone & Email)
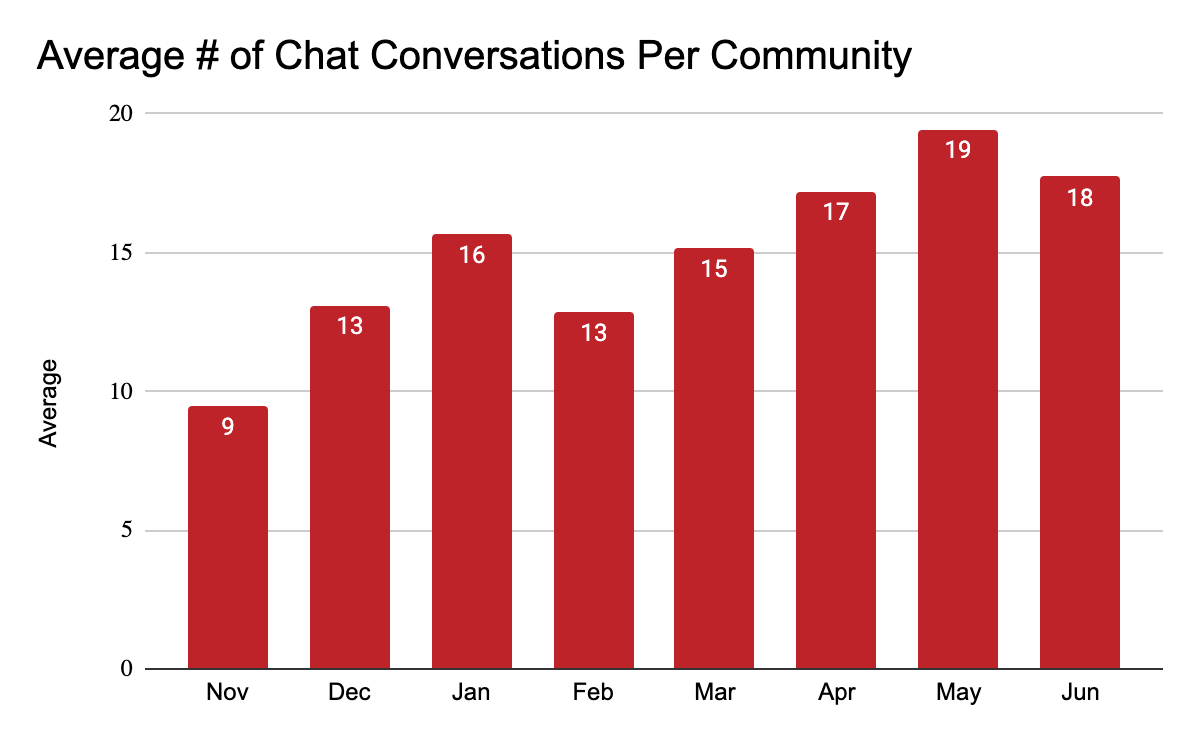
Live Chat conversations, phone calls, and emails to leasing teams are all signs that renters are actively inquiring about properties and moving beyond the browsing stage. We saw a rise in overall communication with leasing teams across our multifamily client base from March to June.
The following call and email data represent click to call data and click to email data from a sample of over 600 apartment websites.
Live chat conversations from our client’s apartment websites increased a total of 36% March-June compared to the four months prior.
4. Scheduled Tours
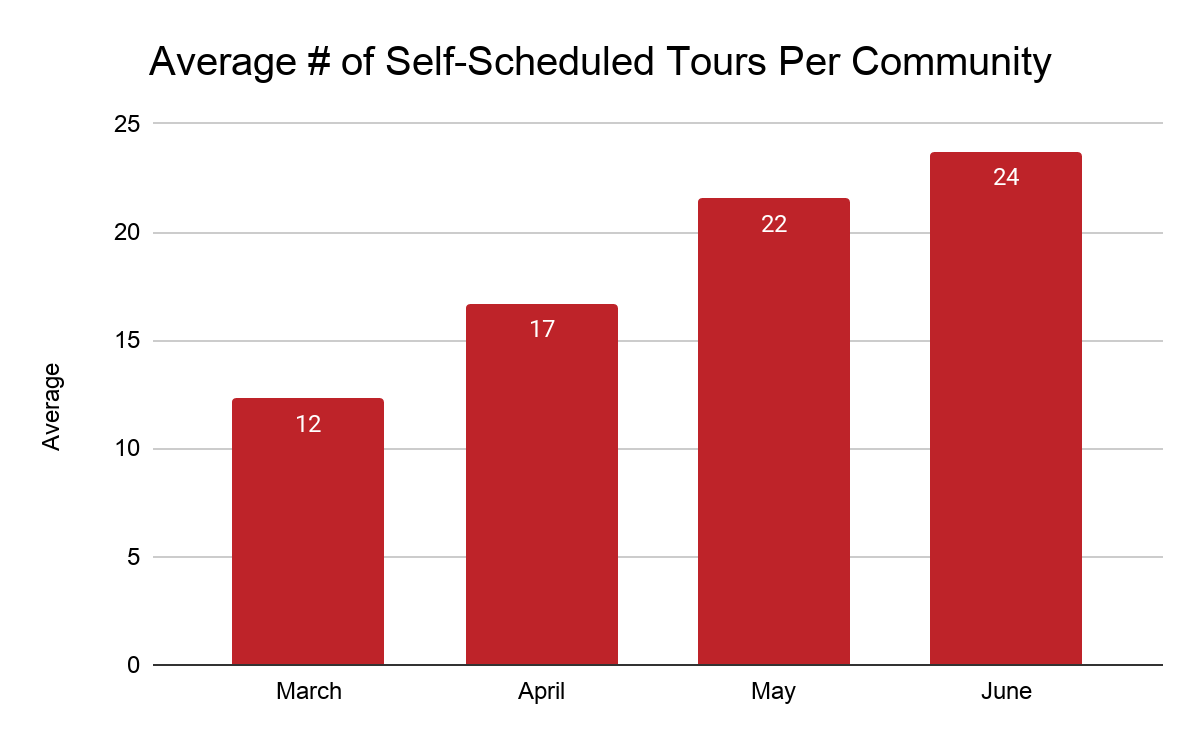
At the beginning of the pandemic, communities worried about their ability to lease apartments in a situation where prospective residents couldn’t easily tour the building. Communities switched from an in-person tour model to a virtual tour model overnight. Many apartment seekers were ok with this shift and we saw communities scheduling tours again at the end of March. We have a few hundred communities who used our tour scheduling platform to promote and schedule virtual tours throughout the pandemic. The average number of tours each community scheduled increased month over month throughout the pandemic. The average community self-scheduled 24 tours last month, twice the average of March.
5. NMHC Rent Payment Tracker
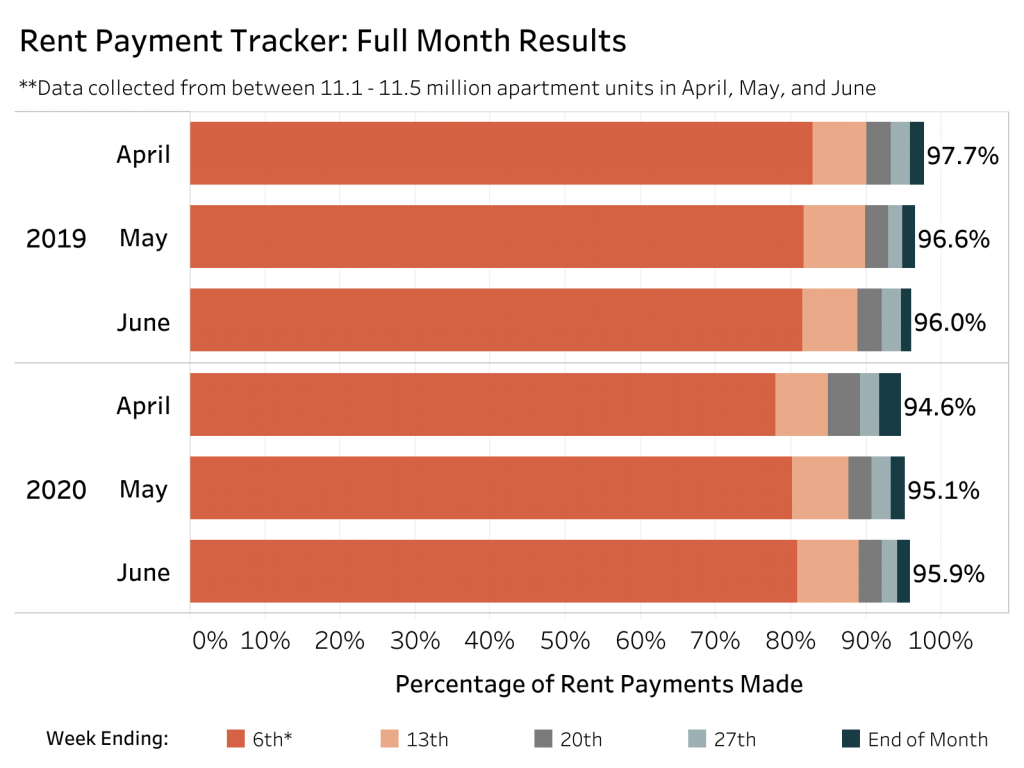
One of the biggest questions the industry had at the start of the pandemic was whether renters would be able to make rent payments. The National Multifamily Housing Council collaborated with several apartment industry data sources to assess the percentage of renters to pay their monthly rent. Throughout the pandemic, the rate of rent payments remained higher than predicted. Rent payment rates by the end of April, May, and June remained in the ninety percent range and only slightly deviated from last year.
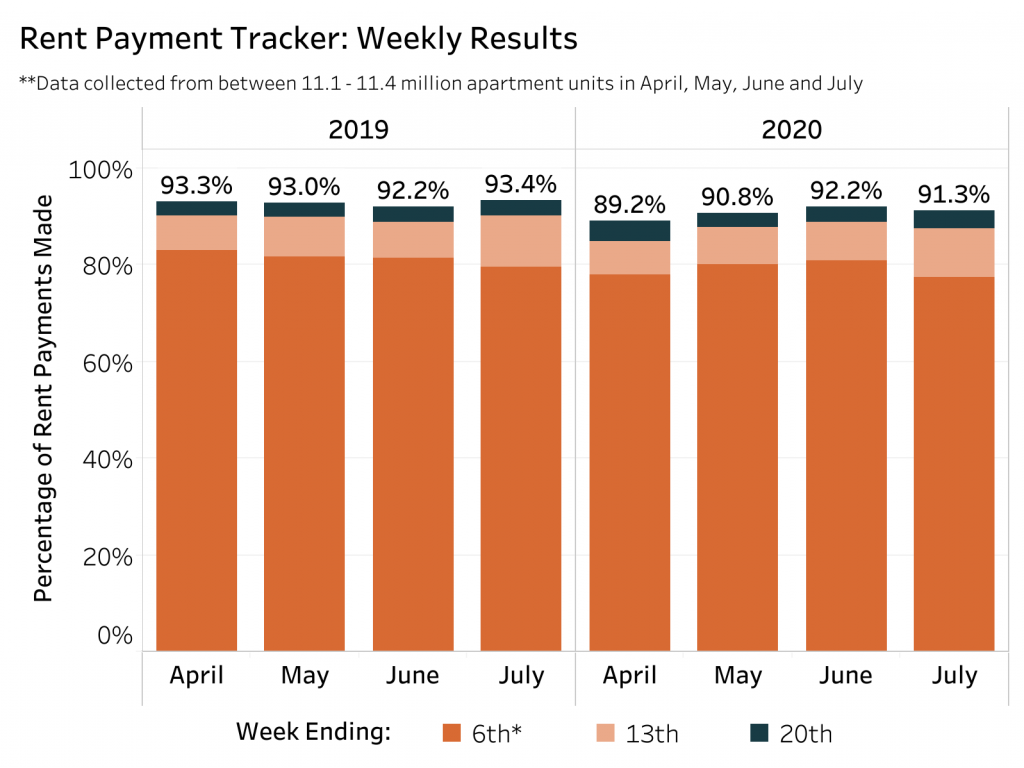
When comparing weekly rent payment rates, July payments were only down 2 percentage points from last year by July 20th.
*It’s important to note that not all of the rental properties in the U.S. are represented in this tracker. Only professionally managed multifamily communities with 5+ units are tracked. While this represents a large portion of the rental market it underrepresents 1-2 unit rentals which have fared differently in the recession than the larger multifamily communities we’ve worked with.
6. Survey Results
In late March, Rentcafe interviewed apartment seekers about their willingness to move during the pandemic. In this survey of over 6,000 renters, they found that a majority (60%) were not planning on postponing their move. 49% said that their preferences had not changed compared to what they were looking for before.
Zumper conducted a more recent survey of over 500 renters at the end of April to see how the apartment outlook had evolved throughout the pandemic. When asked how COVID-19 has changed their apartment search criteria, the most popular response was “looked for more virtual tours” (34%). Surprisingly when asked about the biggest challenges renters are facing in their apartment search the most popular response at 55% was not receiving a response back from a community.
The current state of the apartment search process is not without its trials. 52% of apartment seekers say they prefer in-person tours over virtual tours despite the rising popularity of virtual tours. While most apartment seekers still plan to move and nearly half have not changed what they are looking for in an apartment, 28% of renters are looking for a cheaper apartment (RentCafe) and 19% are expanding their search radius (Zumper). However, a small portion of renters (5%) are actually increasing their budget and 9% are narrowing their search radius (Zumper).
Making Sense of the Signals
COVID-19 hasn’t changed the desire for most apartment seekers to make a move. The recent surge in apartment searching online, the increase in engagement with leasing teams that occurred from March to June, and the rise in self-scheduled tours indicates that there is still an active renter base looking to move despite the changing environment.
Among current residents, rent payments for the full month of June indicated that most apartment seekers were able to pay rent and rent payment rates remained very similar to payments before the pandemic.
So what has changed? The apartment search process, which has become even more virtual than before. Google searches, website traffic, self-scheduled tours, and live chat conversations have all increased in popularity year over year. While apartment search behavior has historically always peaked in the Spring and Summer, time will tell if the current rise in apartment searching will carry over into fall.
Stay up to date on the latest multifamily marketing trends. Fill out the footer form below to subscribe to our multifamily marketing newsletter and receive invitations to our upcoming webinars.
